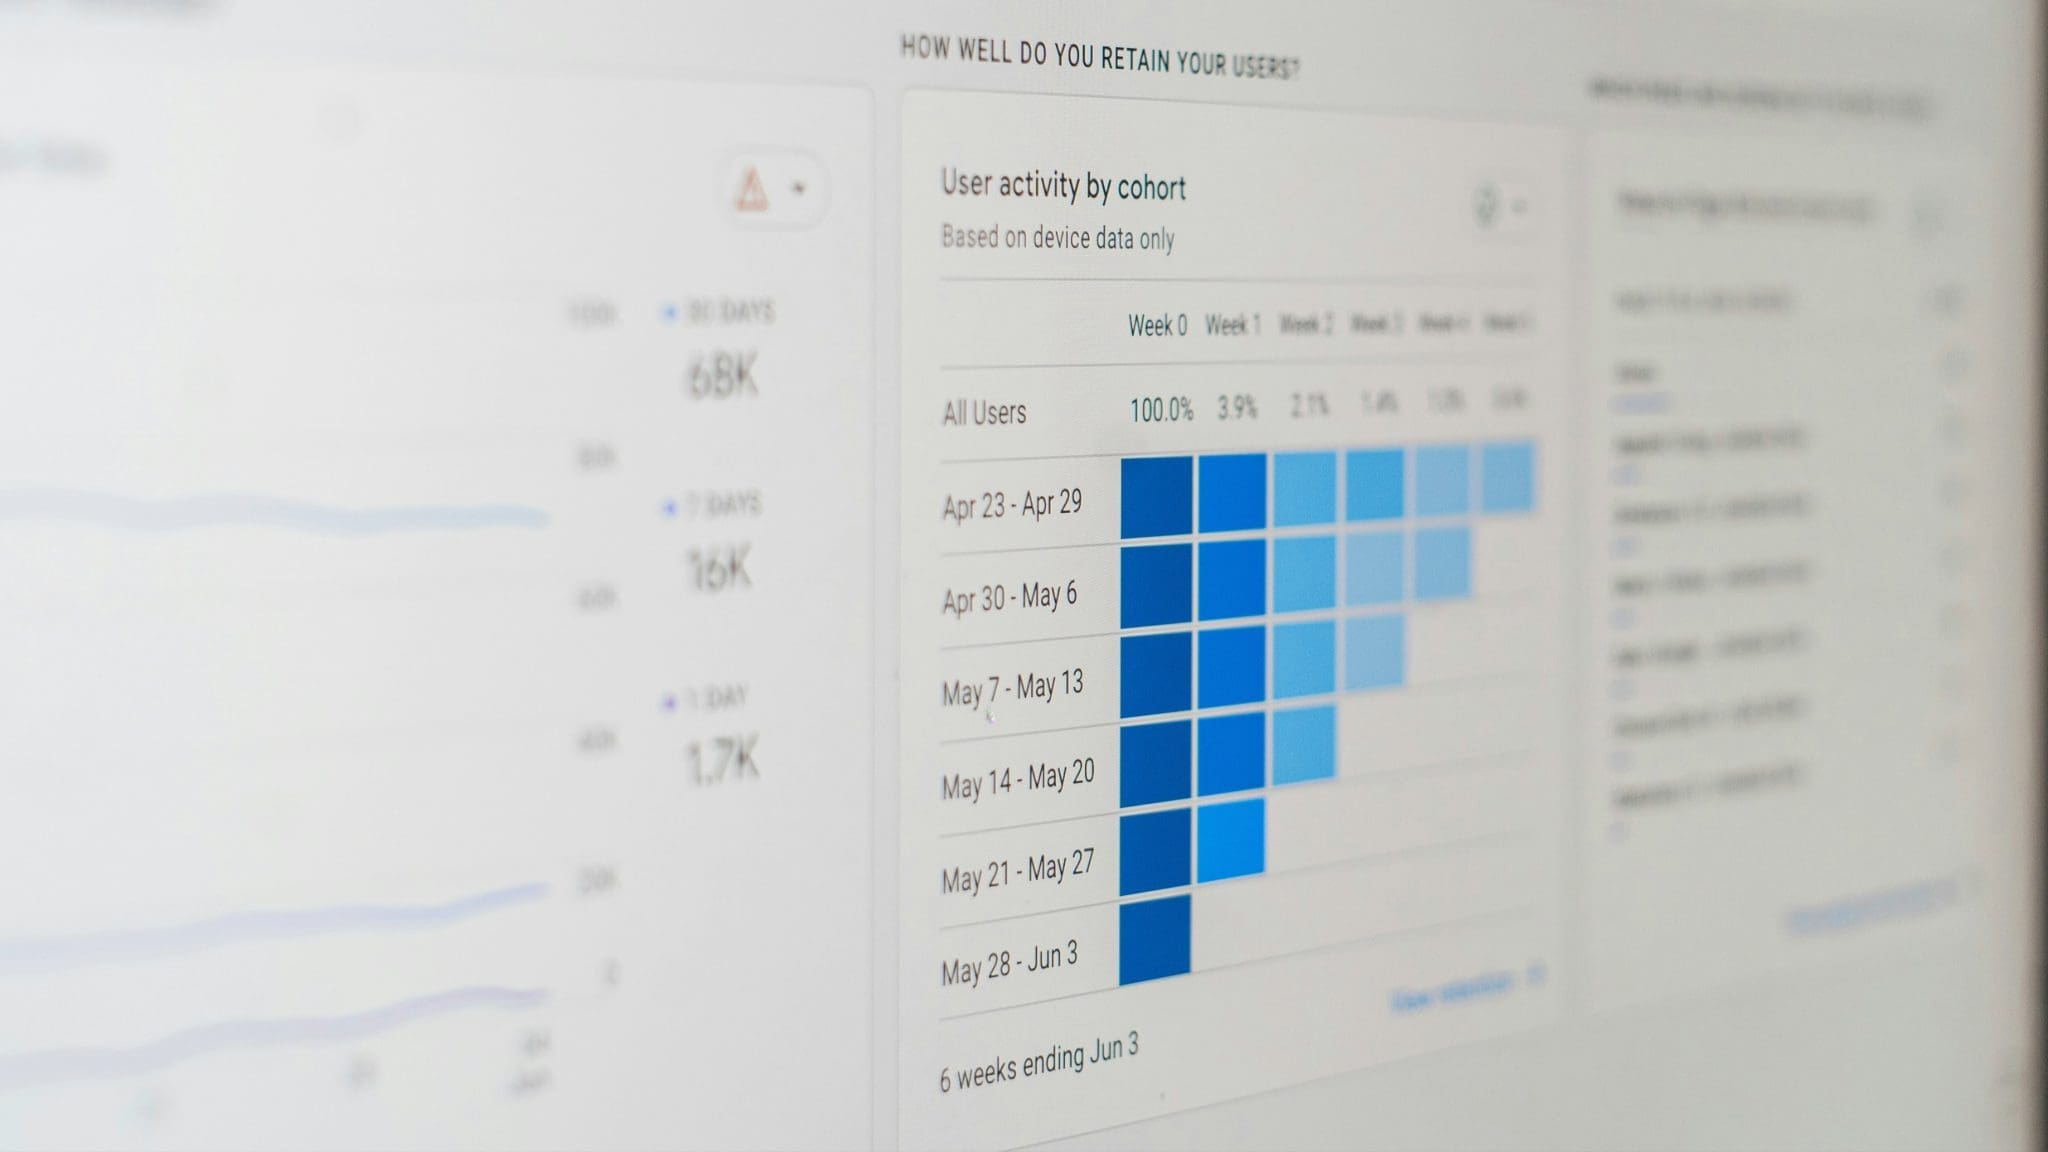
Attention spans keep shrinking, and grabbing one for even a few seconds is genuinely hard work these days. The use of effective visuals in marketing gets your point across fast and helps boost reader engagement in a way plain text rarely can.
We react to visuals within 50 milliseconds, which is faster than most people can consciously register what they’ve seen. Around 70% of our sensory receptors sit in our eyes, and we process imagery more than 60,000 times faster than text, retaining far more of what we see along the way. Visuals also activate roughly 50% more of the brain than text does, which is exactly why visualisation in marketing matters so much.
The numbers back this up everywhere you look: Facebook posts with images get 2.3 times more engagement than those without, so getting the image right, logo placement, colour balance, the actual subject, genuinely shapes whether a customer engages and remembers what they saw. It’s no coincidence that 80% of marketers already use visual assets across social media, and video has become the go-to format for high-engagement campaigns, with over 63% of marketers now using it.
Here are a few tips to help you get started.
Make Your Brand Instantly Recognisable
Keep your branding clear, strong, and consistent enough that people recognise it within milliseconds. Your logo, your brand colours, and a recognisable font or typeface all do heavy lifting here, and using them consistently is what makes your content instantly identifiable as yours.
Substance Over Polish
Image quality matters, but that doesn’t mean everything needs a full production budget. Add your own branding to stock images where it helps you stand out, or better yet, shoot your own photos on a smartphone. Not every image needs to be polished within an inch of its life, an iPhone shot can genuinely surprise you with how well it performs.
Put Video to Work
Video is one of the most important pieces of content marketing you can invest in, and posting it consistently is close to a guaranteed way to lift engagement. Keep it short: 30 seconds or under is the sweet spot.
Turn Data Into a Story
Turning complicated data into something visual makes it genuinely engaging instead of forgettable. Break down complex numbers into something easy to digest and pleasant to look at, and even the most mundane statistics start pulling real engagement. Chances are you’ve scrolled past an engaging infographic in the last few years that turned a dry set of stats into something you actually stopped to read.